Your trading ideas,tested in seconds.
Ask Claude or ChatGPT. StillQuant backtests your idea on real market data, costs and drawdowns included.
Suggestion: Ask Claude how the S&P 500 did in the year after a 10% drop
See the facts before you decide.
Company filings, backtests and plain-English answers, each traced to its source.
X-ray any stock

NVIDIA (NVDA)
Fiscal 2026, 10-K filed 25 Feb 2026
- Revenue
- $215.9B+65.5% vs fiscal 2025
- Gross margin
- 71.1%
- Net margin
- 55.6%
- R&D
- 8.6%of revenue
- Free cash flow
- $96.7B
Source: SEC filing (10-K)

Apple (AAPL)
Fiscal 2026, 10-K filed 3 Nov 2026
- Revenue
- $478.8B+15.1% vs fiscal 2025
- Gross margin
- 48.8%
- Net margin
- 27.6%
- R&D
- 9.6%of revenue
- Free cash flow
- $136.1B
Source: SEC filing (10-K)

Microsoft (MSFT)
Fiscal 2026, 10-K filed 29 Jul 2026
- Revenue
- $331.8B+17.8% vs fiscal 2025
- Gross margin
- 67.9%
- Net margin
- 40.3%
- R&D
- 10.7%of revenue
- Free cash flow
- $67.0B
Source: SEC filing (10-K)
Backtest your strategy
Hypothetical backtest. Past results don't predict future ones.
Ask in plain English
Screen the market
From idea to backtest.
StillQuant works inside Claude or ChatGPT as a set of tools. Here's one idea, start to finish.
Describe your idea
Type it the way you'd say it, in the box above or right inside Claude or ChatGPT.
What if I'd held SPY only above its 200-day average?
BacktestClaude calls StillQuant
Claude turns your words into rules. StillQuant checks them and replays every session on real prices, costs included.
Claude using StillQuant
Get price history SPY, daily since Jan 2023
Check strategy rules Ride the 200-day line
Enter: SPY closes above its 200-day average
Exit: a close below it, then cash at 0%
No stop loss: the deepest drawdown is limited only by the exit rules.
Run backtest 764 sessions, 2 bp per side
Backtest readySee what it would have done
Return after costs and the deepest drawdown, next to simply holding SPY. Hypothetical, never a forecast.
Ride the 200-day line
Backtest – hypothetical+63.7% total since Oct 2023, after costs
- SPY, same period
- +77.7%
- Invested
- 92% of days
- Deepest drawdown
- −9.1%
- SPY's deepest drawdown
- −20.0%
Total after trading costs, per side
- 0 bp
- +64.0%
- 1 bp
- +63.8%
- 2 bp
- +63.7%
- 5 bp
- +63.1%
Test your scenarios against history.
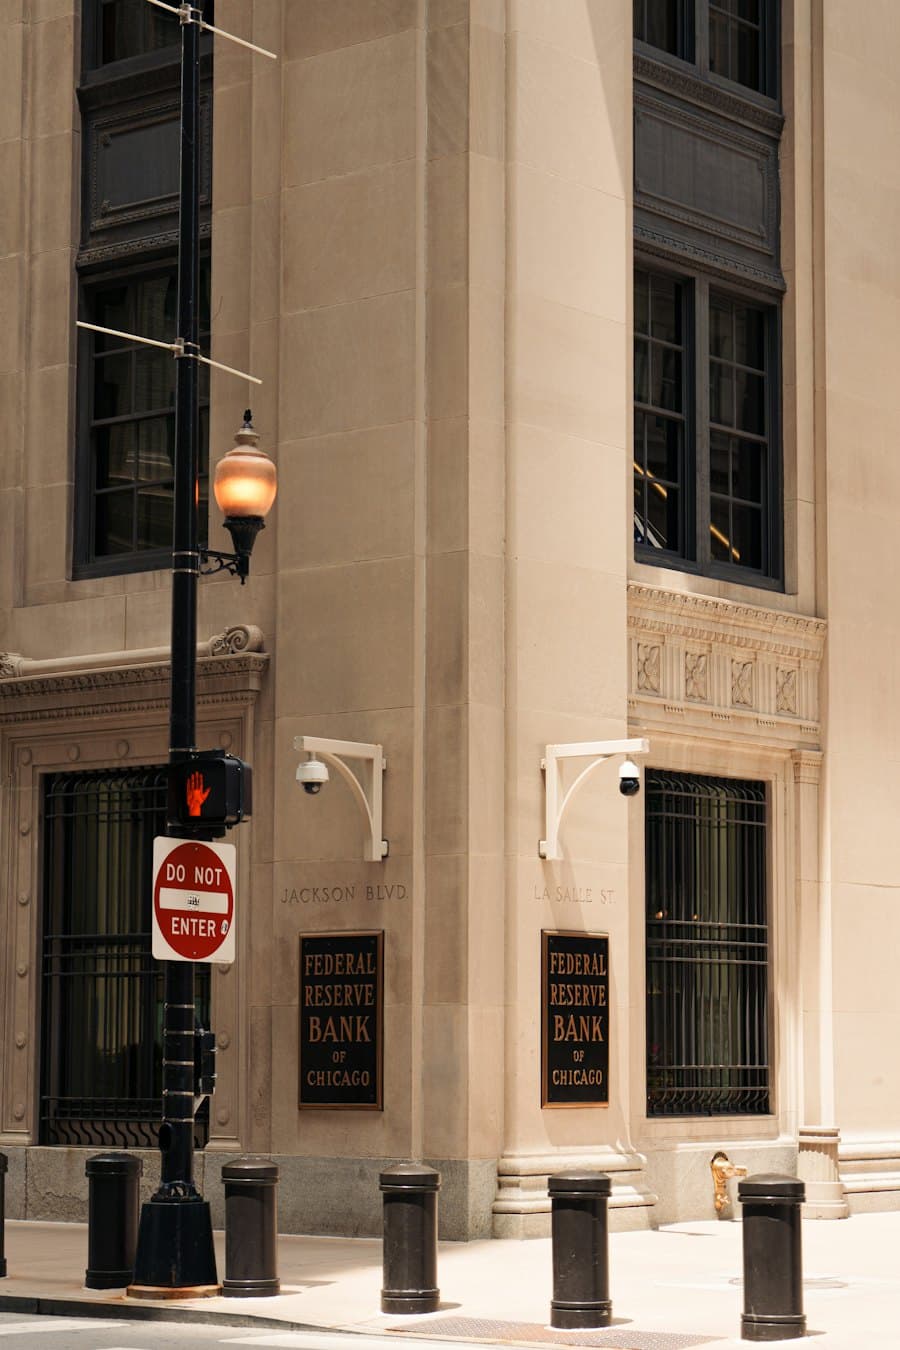
5 of 6 higher
median +9.1%
US stocks a year later, 1994–2022
Date Fed rate after the hike US stocks, next 12 months 4 Feb 1994 3.25% +5.4% 25 Mar 1997 5.5% +48.4% 30 Jun 1999 5% +10.6% 30 Jun 2004 1.25% +7.6% 16 Dec 2015 up to 0.5% +13.6% 17 Mar 2022 up to 0.5% −8.9% 
1 of 3 higher
median −8.7%
US stocks a year later, 2008–2022
Date Brent close US stocks, next 12 months 29 Feb 2008 $100.90 −42.6% 1 Feb 2011 $100.40 +4.4% 14 Feb 2022 $101.66 −8.7% 
8 of 9 higher
median +3.4%
SPY 20 sessions later, 2023–2025
Date SPY, open to open SPY, next 20 sessions 19 Jan 2023 −2.4% +5.0% 10 Mar 2023 −2.2% +4.0% 2 Aug 2024 −3.1% +4.7% 19 Dec 2024 −2.1% +2.4% 27 Jan 2025 −2.5% +0.4% 4 Mar 2025 −2.8% −3.8% 4 Apr 2025 −3.9% +7.4% 1 Aug 2025 −2.1% +3.4% 14 Nov 2025 −2.2% +3.0%
Your favourite podcasts, turned into strategies.
Every episode becomes rules you can backtest.



Everything your AI is missing.
Real market data, charts and backtests for Claude or ChatGPT. Soon: screens, alerts and agents that watch for your conditions.
Agent Coming soon
Thu 15 June 2023 · after the close
Microsoft just closed at a record. What do analysts say?
Read 53 ratings
A record close, up 3.2%
Read 5 SEC filings
Revenue by quarterQuarter to 31 Mar 2023
$52.9B+7.1% on a year earlier
- Operating margin
- 42.3%
- Net income
- $18.3B
A record close, 44 of 53 analysts at Buy, revenue up 7.1% on a year earlier. The level to watch is the old record, $343.11.
Alert rule
Alert me if MSFT closes below $343.11
Watching · alerts on WhatsApp
Fri 16 June 2023
What else your agent can do
Hypothetical examples on SPY, Jan 2023 – Nov 2026. Past results don't predict future ones.
- Price feed
- Backtest engine
- Prompts & skills
- News feedSoon
- Analyst ratingsSoon
- Alerts & agentsSoon
Plug in the data the pros use.
Switch on feeds from Europe's and America's best-known providers as each one launches, and your agent watches them.
Set up your agentGerman market news
dpa-AFX · Europe
Company and market news from Germany and Europe, as it breaks.
Macro calendar
Trading Economics · US
Rate decisions, inflation and jobs data – with forecasts – before they move markets.
Xetra & DAX data
Deutsche Börse · Europe
Prices and volumes for Xetra-listed stocks and the DAX.
Pan-European stocks
Euronext · Europe
Stocks listed in Paris, Amsterdam, Milan, Brussels, Dublin, Lisbon and Oslo.
Rates & euro data
European Central Bank · Europe
Policy rates, euro exchange rates and money supply, straight from the source.
Crypto market data
Kaiko · Europe
Trades and order books from the major crypto exchanges.





Congress trading
Quiver Quantitative · US
What US politicians buy and sell, as they disclose it.
Options flow
Unusual Whales · US
Unusually large options trades, the moment they print.
Fund & ETF ratings
Morningstar · US
Ratings and holdings for funds and ETFs – see what you really own.
Real-time news
Benzinga · US
Breaking headlines and analyst rating changes for US stocks.
Moves, explained
MarketReader · US
Why a stock is moving right now, in one line.
Earnings & insiders
Finnhub · US
Earnings dates and surprises, plus what company insiders buy. Personal use only.






Your rules, watching the market.
Get an alert on WhatsApp or by text the moment a rule you set is met, wherever you are.
WhatsApp and text alerts are rolling out to members.
Thursday 5 November
22:16
 WhatsAppnow
StillQuant
Backtest ready. “Buy when fear spikes” since Feb 2023: +61.4% vs SPY +88.9%. Deepest drawdown −7.6%. Hypothetical.
- Text message14 Apr 2026
StillQuant
Your rule “Buy when fear spikes” was met at the close: SPY's 20-day volatility reached 20.0%.
- WhatsApp8 Apr 2026
StillQuant
Your rule “SPY closes back above its 200-day line” was met at the close: 1.9% above it, after 13 sessions below.
Illustration with real figures from StillQuant's published SPY series, last close 5 Nov 2026: rule replays and a hypothetical backtest after 2 bp per side, no taxes. Past results don't predict future ones.
Let your favourite algo talk you through its trades.
It comments on the market while it trades live on paper, and explains every position it opens.
Gold first, rolling out to members.
Get startedDesk AIAI host
On air
Gold · 5 min
14:46DeskThe morning low sits just below. A bounce off there changes my read.
Does your broker already speak AI?
Many now plug into Claude or ChatGPT. StillQuant brings the quant engine, whatever your broker.
Connect to Claude and ChatGPT









Connect to Claude









Show 10 moreShow fewer
More brokers and exchanges

Crypto exchange · Outside the US · Claude and ChatGPT

Crypto exchange · Outside the US · Official MCP server

Market data only · Global · Claude

India · Claude

India · Official MCP server

Crypto exchange · US and more · Claude

India · Claude

India · Claude

Crypto exchange · Global · Official MCP server

Crypto exchange · UK and EEA · Claude
You stay in control.
Read-only
StillQuant reads, tests and reports. It never places a trade.
Demo first
Every algo runs on a demo account before any real money.
Your broker, your switch
Your capital stays with your broker, in your name.
Built in-house with Claude
Meet Claude Momentum.
A fast momentum algo we developed and keep refining with Claude. It goes after the strongest movers in liquid US stocks and never holds for long – about 3 trades a day.
See every trade+84.3%a yearSPY +20.0% a year
- Deepest drawdown
- −24.2%
- Trades
- 2,868
- Winning trades
- 55%
- Positive months
- 33/47
- Claude Momentum$104,528.69
- SPY buy & hold$20,115.87
Table
| Month | Claude Momentum | SPY buy & hold |
|---|---|---|
| $10,064.77 | $10,538.37 | |
| $10,656.64 | $10,437.74 | |
| $10,911.81 | $10,629.81 | |
| $9,524.90 | $10,810.85 | |
| $9,790.61 | $10,989.78 | |
| $10,293.68 | $11,598.31 | |
| $11,466.30 | $12,020.81 | |
| $11,483.22 | $11,868.41 | |
| $10,676.97 | $11,340.29 | |
| $10,630.61 | $10,936.97 | |
| $10,758.91 | $11,967.47 | |
| $11,130.09 | $12,519.25 | |
| $11,703.31 | $12,839.28 | |
| $13,686.47 | $13,347.43 | |
| $14,266.46 | $13,747.60 | |
| $15,002.36 | $13,363.99 | |
| $16,530.05 | $13,758.90 | |
| $18,787.65 | $14,376.36 | |
| $18,621.85 | $14,424.97 | |
| $16,456.78 | $14,733.44 | |
| $18,664.01 | $14,988.57 | |
| $20,875.72 | $15,124.67 | |
| $29,712.41 | $15,753.96 | |
| $31,652.06 | $15,501.20 | |
| $30,222.01 | $15,961.01 | |
| $31,703.90 | $15,385.85 | |
| $30,977.95 | $14,448.09 | |
| $30,713.65 | $14,387.66 | |
| $30,790.53 | $15,473.34 | |
| $35,113.96 | $16,222.97 | |
| $40,055.87 | $16,804.17 | |
| $38,137.39 | $17,012.80 | |
| $49,238.54 | $17,418.74 | |
| $59,172.71 | $18,000.21 | |
| $57,501.11 | $17,891.96 | |
| $60,673.50 | $18,053.81 | |
| $81,759.06 | $18,179.93 | |
| $80,311.79 | $17,944.24 | |
| $75,533.53 | $16,786.83 | |
| $86,330.97 | $18,779.00 | |
| $98,701.48 | $19,862.32 | |
| $106,296.63 | $19,475.55 | |
| $105,075.54 | $19,567.78 | |
| $106,802.02 | $20,160.01 | |
| $116,031.66 | $20,141.62 | |
| $102,692.93 | $20,008.39 | |
| $104,528.69 | $20,115.87 |
Annual return by trading cost per side
- 0 bp
- +108.8%
- 1 bp
- +96.2%
- 2 bp
- +84.3%
- 5 bp
- +52.9%
Simulated results on past data, with settings chosen on this same period. They are not live trading, include leverage, and are not a reliable indicator of future results. You can lose more than the backtest's worst drawdown.
Build your own with Claude or ChatGPT.






What do you believe in?
Popular ideas, put to the test. Hover one to see if it held up.Tap a card to see if it held up.
Hypothetical backtests on SPY, Jan 2023 – Nov 2026, after 2 bp per side. Out of the market = cash at 0%. No taxes. Past results don't predict future ones.